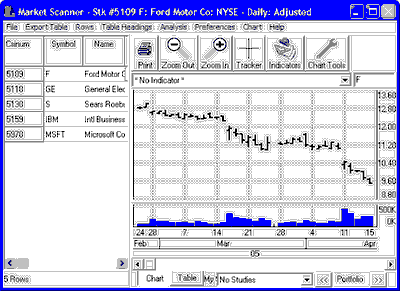
The file list at left functions much like an Unfair Advantage portfolio during your MarketScanner session.
Manipulate the chart with these features:
 Studies may be added by clicking the "Indicators" icon on the tool bar above the chart. Please see the "Study Toolbar" section of the UA Charts chapter for details.
The Saved Study text box below the chart (which shows "No Studies" in the above example) can also be used to view previously saved studies or add new ones. Click the arrow at the right edge of the box to see the list of available studies and make your choice. See the Saving a Study topic in the Basic Charting chapter for more information. Whatever study is listed in this box will apply automatically to subsequent charts.
 Click the Printer icon on the tool bar above the chart to print your chart.

 Zoom In and Zoom Out by clicking these icons on the tool bar. - This feature changes the spacing of the price bars, allowing you to see more or less of the data. Use the scroll bar at the bottom to see the rest of the chart.
 Click the Chart Tools icon on the tool bar above the chart to add your choice of a Trend Line, Annotation, Rectangle, Ellipse or Gann Fans. Click the Chart menu above the tool bar as an alternate method to reach most of these features. These are explained in the Charting chapter. See "Apply Tool."
Although the MarketScanner chart is a fairly impressive study tool, the program offers much more for serious analysts. From here you may sort and filter as desired, and add studies to the exercise. A simple way to begin is through the MarketScanner Wizard.