UA Charts
Previous  Top  Next

Charting is an important Unfair Advantage feature that lets you quickly see what is happening in the markets of interest to you. It also provides opportunities for graphic analysis.
 
After your initial retrieval session, you can view the charts that are listed in the sample portfolio or your own custom portfolios, and you can view charts that you make on demand. You can also analyze the data files specified in your portfolios with compatible software of your choice, but only after the files have been created through UA.

You must unlock your database by
downloading and fully distributing a day of data before you can create any charts!

Here is an example of UA charts:
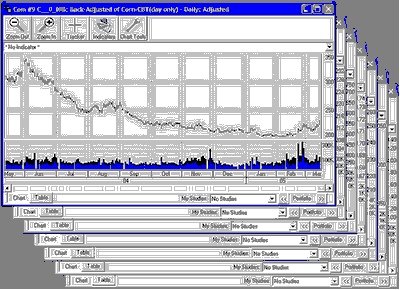
charts

The "UA Charts" chapter of this manual begins with simple instructions to display charts that have already been identified in a portfolio or through Market Specifications, then offers four subchapters that explain:

·Creating New Charts (includes defining continuous contracts)  
·Chart Interpretation & Manipulation  
·The Study Toolbar  
·The Chart Menu  
·Right-Click Menu (for manipulation)  
·Charting Preferences  
 
A subsequent chapter called "Interpreted Studies" describes and explains the different types of analysis available through both Unfair Advantage's charting module and MarketScanner.

Click the link above that reflects your current interest.