Charting From a Portfolio
Previous  Top  Next

The simplest way to view a chart is to select it from a portfolio. Here's how to view such a chart:

Charting a Single Item

To chart a single item from a portfolio, scroll through the list of files in the Portfolio Manager panel at the left side of your screen (shown below) and then click the desired commodity or stock entry.

You'll note that the initial display shows "*All*" in the "Select Portfolio" box. This selection enables a listing of all series in all portfolios. If you prefer to choose from a single portfolio, click the arrow at the right edge of the box to drop down a menu of all available portfolios. Click the desired commodity or stock from the list.
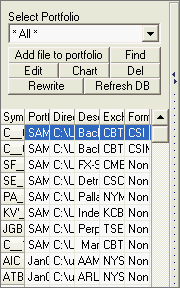

portfolios


Once the data series has been selected, use one of the following three methods for charting:

1) Click the [Chart] button in the Portfolio Manager panel. A chart displays.

2) Double-click the entry in the Portfolio Manager panel. A chart displays.

3) Right-click your mouse, which produces the following menu. Click "Chart Series" and a chart displays.
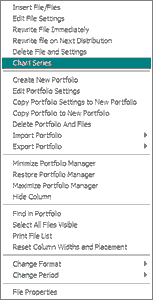
chartmen


4) Click "Portfolio" at the top of your screen to display the Portfolio Menu (much like the above example). Then click "Chart Series." A chart displays.

Charting Multiple Portfolio Items

You may chart multiple items from your portfolio list simultaneously, but they are subject to the charting limit (usually 12) set in Memory Cache Size (on the Advanced 1 screen of General Program Settings in your UA Preferences). Whenever multiple charts are created, some may not be visible initially. Use the Windows menu to select your desired presentation of multiple charts.

To chart consecutive items in your portfolio list, click on the first item to be charted. Then press and hold down the <shift> key while clicking on the last item to be charted. All items listed between your first and last selections, inclusive, will be selected. Use any of the charting methods described above (except double-click) to chart the selected files.

To chart selected, non-consecutive items in your portfolio list, click on the first desired file, then press and hold down the <Ctrl> (Control) key while clicking the additional series you want to chart. Only your selected files will be highlighted. Use any of the charting methods described above (except double-click) to chart the selected files.

To chart all items in a portfolio, click any single item in the portfolio list, then right-click your mouse and click "Select All Files Visible" from the menu. Right-click again and then click "Chart Series." If your portfolio holds more items than the limit for Memory Cache Size (on the Advanced 1 screen of General Program Settings in your UA Preferences), a warning will display and the limit will be imposed.


If the series you want to chart isn't in a portfolio, you can create a chart from scratch as described in the Creating New Charts chapter.

See the Chart Interpretation & Manipulation chapter for information on interpreting and manipulating your chart.