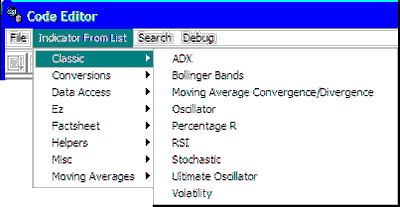
· Classic
| · ADX(14) = 14-day ADX needs 53 days
|
| · BollingerBands(15,1.5) = 15-day Bollinger Bands
|
| · ChakinOscillator(3,10) = Chakin Oscillator
|
| · Macd(5,10,3) = 5,10,3-day Macd
|
| · Oscillator(5) = 5-day Oscillator
|
| · Percentage_R(5) = 5-day Percent R
|
| · RSI(5) = 5-day RSI
|
| · StocCross(5,3,3) = 5/3/3-day Stochastic Trigger
|
| · Stochastic(5,3,3) = 5/3/3-day Stochastic
|
| · Ultimate_Oscillator(7,14,28) = Ultimate Oscillator
|
| · Volatility(5) = 5-day Volatility
|
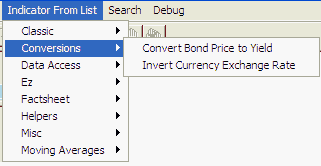
· Conversions
| · InvertExchangeRate(14) = Inverts Price values
|
| · PriceToYield(2,$Close[0]) = The current (2Yr Note) close in Yield
|
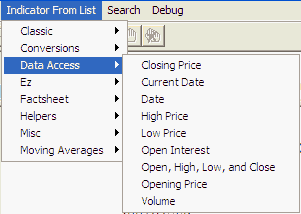
· Data Access
| · C(0) = Close
|
| · H(0) = High
|
| · I(0) = Open Interest
|
| · L(0) = Low
|
| · O(0) = Open
|
| · OHLCStudy() = Returns the current OHLC
|
| · V(0) = Volume
|
· Examples
| · ComputeADOscillator1() = Example function users manual
|
| · ComputeADOscillator2() = Example function users manual
|
| · ComputeADOscillator3() = Example function users manual already documented in manual, perhaps you can reformat
|
| · DetrendedBollingerBands(15,1.5) = 15-day Detrended Bollinger Bands
|
| · FilterBollingerBands(15,1.5,3) = 15-day Bollinger Bands w/ 3-day MA filter
|
| · ModifiedBollingerBands(15,1.5) = 15-day Bollinger Bands based on ATR
|
· Factsheet
| · BigPointValue() = Value in currency for a whole point move
|
| · GetCvf() = Price Format
|
| · GetDividendGrowth5Year() = 5 Year Dividend Growth
|
| · GetDividendYield() = Dividend Yield
|
| · GetEarnings() = Stock Earnings
|
| · GetEarningsPerShare() = Stock Current Earnings Per Share
|
| · GetEarningsPerShareTotalLastYear() = Earnings Per Share Total Last Year
|
| · GetExchange() = Exchange
|
| · GetHasStockFundamentalData() = Has Stock Fundamental Data
|
| · GetIncomeGrowth5Year() = Income Growth for 5 Years
|
| · GetIndustryCode() = Stock Industry Code
|
| · GetLatestAnnualOperatingRevenue() = Last Annual Operating Revenue
|
| · GetLatestAnnualTotalNetIncome() = Latest Annual Total Net Income
|
| · GetMarketCapital() = Stock Market Capital
|
| · GetName() = Name
|
| · GetPE5YearAverage() = PE5 Year Average
|
| · GetPercentageInstitutionalShareHolders() = Percentage of shares held by Institutions
|
| · GetPointValue() = Point Value
|
| · GetPriceEarningsRatio() = Price/Earnings Ratio
|
| · GetRevenueGrowth5Year() = 5 Year Revenue Growth
|
| · GetSectorCode() = Stock Sector Code
|
| · GetSharesOutstanding() = Stock Shares Outstanding
|
| · GetStockBeta() = 36 Week Stock Beta
|
| · GetSymbol() = Symbol
|
| · NumInstitutionalShareHolders() = The number of institutional shareholders for a stock
|
· Helpers
| · AveragePrice(0) = 25% Close + 25% High + 25% Low + 25% Open
|
| · Average_True_Range(5) = 5-day Average True Range
|
| · AvgPrice(20) = AvgPrice
|
| · ChangeOfPriceEarnings(5) = Returns the change in the P/E cased by the change in price over the last period
|
| · TypicalPrice(0) = 33% Close + 33% High + 33% Low
|
| · VolumeRateOfChange(5) = Rate of Change of Volume over last 6 days
|
| · WeightedClose(0) = 50% Close + 25% High + 25% Low
|
· Misc
| · HighestClose(5) = 5-day highest close
|
| · HighestHigh(5) = 5-day highest high
|
| · LowestClose(5) = 5-day lowest close
|
| · LowestLow(5) = 5-day lowest low
|
· MoneyFlow
| · MoneyFlow(5) = 5-day avg of Moneyflow
|
| · MoneyFlow3(20) = MoneyFlow3
|
| · MoneyFlowAsNewspaper(200) = 200 - Day MoneyFlow as Newspaper
|
· Moving Averages
| · EMA(14) = Exponential Moving Average
|
| · MACross(3,5) = 100*(MA3 - MA5)/(MA3 + MA5)
|
| · MAOfClose(5) = 5-day mov avg of close
|
| · MAOfOi(5) = 5-day mov avg of OI
|
| · MAOfVol(5) = 5-day mov avg of volume
|
| · SCTT
|
| · BullBearBalanceIndicator(20,30) = Daily Rise Indicator
|
| · CommodityChannelIndex(15) = 15-day Commodity Channel Index
|
| · CupAndHandle(4) = Cup and Handle Indicator
|
| · DailyRiseIndicator(5,25) = Daily Rise Indicator
|
| · EaseOfMovement = EaseOfMovement
|
| · EaseOfMovementEMA(5) = EMA of EaseOfMovement
|
| · FractalDimensionOfWaveforms(30) = Regularized Momentum Indicator
|
| · HPI(400,0.2) = HPI (Futures Only) where a one-cent move is $400 and a smoothing of 2.0
|
| · HeikinAshi() = Heikin - Ashi Technique
|
| · HeikinAshiDiff() = Heikin - Ashi Diff Indicator
|
| · LWAccDis() = LWAccDis
|
| · LinearRegValue(25,3,@Close) = Linear Regression Prediction of Close 3 bars in future
|
| · LinearRegValueOfClose(25,3) = Linear Regression Prediction of Close 3 bars in future
|
| · MassIndex(9,25) = MassIndex
|
| · OnBalanceVol(50) = 50 - Day On Balance Volume
|
| · OpeningGapIndicator(5,25) = Opening Gap Indicator
|
| · Parabolic(0.01) = Parabolic
|
| · PriceVolumeTrend() = Price Volume Trend
|
| · RecentHighLowDate(5) = Most Recent New High's and New Low's
|
| · Regularized_EMA(14,9) = Regularized EMA Indicator
|
| · Regularized_Momentum(14,9) = Regularized Momentum Indicator
|
| · RevEngRSI_EMA(45,14) = RevEngRSI - EMA Indicator
|
| · RevEngRSI_SMA(45,14) = RevEngRSI - SMA Indicator
|
| · Swing\SwingHigh(1,1,20) = SwingHigh
|
| · Swing\SwingHighBar(1,1,20) = SwingHighBar
|
| · Swing\SwingIndex() = SwingIndex
|
| · Swing\SwingLow(1,1,20) = SwingLow
|
| · Swing\SwingLowBar(1,1,20) = SwingLowBar
|
| · TL\TLAngle(getClose(5),5,getClose(15),15) = TLAngle of line between close of 15 days ago and 5 days ago
|
| · TL\TLSlope(getClose(5),5,getClose(15),15) = Slope of line between close of 15 days ago and 5 days ago
|
| · TL\TLValue(getClose(5),5,getClose(15),15,0) = Extension of line between 5 and 15 days previous draw to current bar
|
| · Time and Implied Volatility and Volume\IIV_Lookback(29,25,252,50) = IIV_Lookback Indicator
|
| · Time and Implied Volatility and Volume\IIV_Thresholds(29,25,252,50) = IIV_Lookback Indicator
|
| · Time and Money Charts\TMChanLinesHi(25) = Chan Lines Hi Indicator
|
| · Time and Money Charts\TMChanLinesLo(25) = Chan Lines Lo Indicator
|
| · Time and Money Charts\TMStochMom(12,25,2) = Stochastic Momentum Indicator
|
| · VolAccDist(10) = 10 - Day Accumulation/Distribution of Volume
|
· Unclassified
| · AtTheMoneyCallOptionVolume() = Call volume for the nears out of the money strike
|
| · EmergMkt(20,3) = EmergMkt 20/3
|
| · FiniteVolumeElement(0.003,22)
|
| · MovingAverageEnvelope(15,7) = 7% bands around the 15-day moving average
|
Study Examples in AnyLanguage
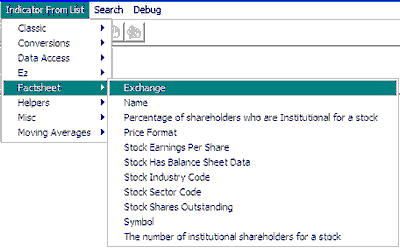
The Classic study menu:
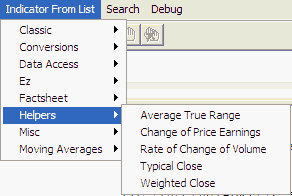
The Helpers menu:
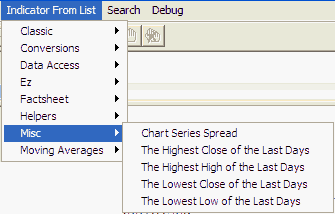
The Misc (Miscellaneous) menu:
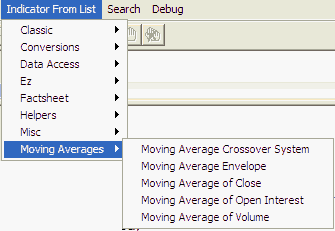
The Moving Average menu:
When you are finished writing or editing your study, you might want to test and debug it. (Not available for all languages.)