Optimizing a Study
Previous  Top  Next

Optimization is the process of systematically testing a range of values in a study algorithm to find the combination that best meets your goals. It is available for studies run in the Perl Fast Mode language.

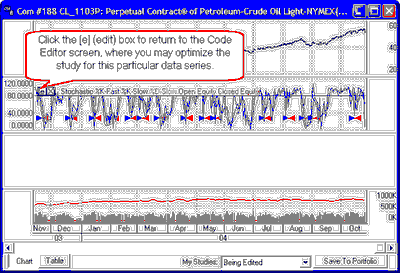
Optimization can be useful if the study being run includes explicit buy and sell signals. If the study you have programmed includes specifications for when to buy and sell, or if you are running a sample study that includes these characteristics, the you may use this feature to optimize the parameter values. See the graphic below for an example of a chart showing buy and sell signals. If your chart includes these directional arrows, then a valuable optimization exercise is possible.

When NOT to optimize:


If your study produces no buy and sell signals, then an optimization exercise will not yield meaningful results.

If your study produces very few signals, say 30 or fewer over the study period, then optimization is not recommended because of the possibility of curve-fitting, which can artificially enhance the apparent ability of your study to predict market movement. Before acting on any study results, please use UA's Trading System Performance Evaluator to evaluate your study.

What can be optimized:

Both charts and market scans can be optimized. However, the method of initiating the optimization is dependent upon whether you are optimizing data to a specific chart or to a MarketScanner run. Once you get the process started, it is basically the same for both.

Initiating optimization of a chart:

Before you can optimize a study on a chart, you must first create the chart and then select and run the given study. Although you won't know the ideal parameter settings to introduce into the expression, make your best guess or use the defaults supplied to get started. Once the study results are displayed, click the [e] box, as shown to return to the Code Editor where you should click the [Optimize] button to run an optimization exercise.
clicke


Initiating optimization of a MarketScanner run

You can optimize the parameters in an Interpreted UA/MarketScanner study by selecting the desired study through the Analysis menu and then clicking the [Optimize] button at the bottom of the Code Editor form.

The Optimize form

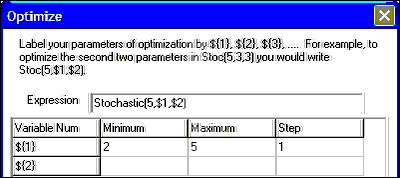
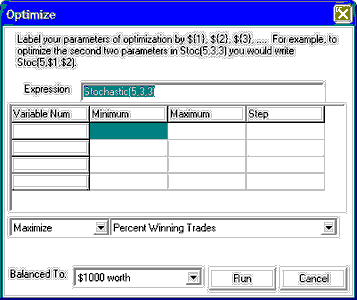
Whether you are initiating your optimization from a chart or a MarketScanner table, when you click the [Optimize] button on the Code Editor screen, the Optimize form displays as shown here:


optimize


Identifying variables to test

The "Expression" at the top of the new form is the same one listed on the Code Editor form. Edit this expression to identify the variables to be optimized. This is done by inserting a dollar sign ($) in front of the value to be tested and then isolating the variable number, shown in curly brackets ({}) in the example at the top of the screen. To optimize the first and second moving averages in the Stochastics formula (which are the second and third parameters), you would edit the expression as follows:

Stoc(5,${1},${2})

The use of the dollar sign, the curly brackets and the number one (${1}) identifies this as the first variable to be tested, not as the first parameter. Curly brackets are recommended for use around the variable number to avoid confusion, as ${1}, but they are not absolutely required in most cases.

When curly brackets are omitted, this expression is written as:

Stoc(5,$1,$2)


Important Note:
The more variables you choose to test simultaneously, the longer the optimization will take. The time increases exponentially! Also, the more parameters you optimize, the greater the chances of curve-fitting your study to the extent that it will not produce good results in real-time applications.

Minimums, maximums & step values

Once you have edited the expression to identify the parameters to be tested, click any of the cells in the table relating to "Variable Num," "Minimum," "Maximum" or "Step." This will activate these cells so you can enter the desired values for your optimization exercise.

For example, if you are optimizing the two moving averages used in Stochastic calculations, (as in the Stochastic example, above), then you might want to limit the tested values to a rather narrow range. The suggested averages are three (3) days each, but you might want to see if results would be better with a first average of, say, two to five days. Variable ${1} is listed in the first row of the table, so you would enter these minimum and maximum values in the appropriate columns as shown here:

minimum


The step value determines the progression of tested values within the range. For a small range from two to five, you would probably want to test every possibility, so your step value would be one (1). Enter it in the third column as shown above.

If your range was wide, say, from one to 100, you might want to sample every other value using a step value of two (2) or perhaps every fifth or tenth possibility by entering 5 or 10, respectively. A high step value would allow you to narrow down the possibilities in a reasonable amount of time, so that you could do a more refined optimization on a smaller set of values later. Mixed integers, such as 1.5, might be appropriate for some parameters and may also be used.

Enter the minimum, maximum and step value for each parameter to be tested.

Choose the optimization goal and whether to minimize or maximize results

The optimization goal field determines which result UA will seek to optimize through this process. You must decide if your goal is to produce the highest net profit, the least gross loss, or a host of other possibilities. Therefore, the next two inputs are inextricably linked.

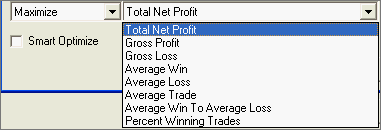
It's usually easiest to start with the goal field, which is in the lower, center portion of the form:

optgoals


Click the arrow next to "Total Net Profit" to display a list of possible optimization goals. Choose the one you wish to minimize or maximize in this exercise.

Next, use the selection box to the left to make your choice of "Maximize" or "Minimize" that corresponds to your desired optimization goal. If you are seeking the most profit, highest percent winning trades, or most of anything else, your choice should be "Maximize." If you want a small outcome, such as gross losses, choose "Minimize." If your preference is not displayed, click the arrow next to "Maximize" or "Minimize" and then select the opposite outcome from the drop-down menu.

Smart Optimize

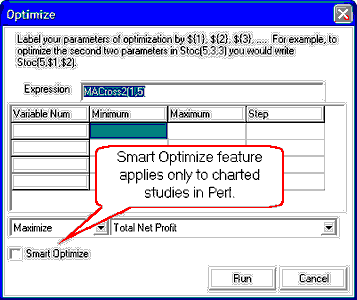
Smart Optimize is a feature aimed at shortening the time required for optimization of a charted study by reducing the number of variables tested. It begins by selecting a variable set that is midway through the allowed range for each variable and then looking at the surrounding parameter sets to see if any are better. If none are better, it stops. Otherwise, it moves to the best known set of parameters and again looks at the surrounding parameter sets for something better. This is a useful way to get a reasonable set of parameters for a new system, but in most cases it does not find the best set of parameters. It can help you narrow down the range of variables for each parameter, which you might use later to speed a more precise optimization exercise.

smartopt


Smart Optimize can only be used only when:

·The optimization goal is either maximum AverageTrade or maximum TotalNetProfit  
·The study involves a chart, not a scan with MarketScanner  
·An Interpreted Study is analyzed  
·The Language Mode for the study is Perl  

To use this feature, you must identify the variable(s) to test and set minimums, maximums and step values as described above, as well as meet the specific Smart Optimize criteria described here. To take full advantage of this "smart" feature, we recommend using a fairly broad range of possible parameters.

Click the checkbox to include Smart Optimize as part of this exercise. You will likely want to repeat the optimization again without Smart Optimize, using a smaller range (as determined by your Smart Optimize session) for each parameter so that you can fine-tune the results.

Balancing Markets

The "Balance To:" option shown at the bottom of the example screen at the beginning of this topic does not appear when optimizing a study through UA's basic charting module. It is only available when optimizing studies through MarketScanner by selecting "Insert Indicator" from the MarketScanner "Columns" menu.

A MarketScanner exercise might involve analysis of markets whose values are inherently different, such as a stock and a futures contract. The stock's value would typically be one dollar per point in price, whereas the value of a one-point move in the futures contract could be significantly more. These differing values can cause problems when attempting to compare or monitor the value of a group of markets. The "Balance To" feature allows MarketScanner to balance the values equally using your preferred unit of measure.

Click the arrow next to the "Balance To" box to drop down a menu of options. You'll have a choice of balancing values by:

·Value ($1,000, $10,000 or $100,000)  
·Standard Deviation (Stddev of $1,000; $5,000; $10,000 or $100,000, which represents volatility)  
·Custom (user-defined value set by modifying the supplied code)  

Make your choice and click [Run] to proceed.

Performing the optimization

Click [Run] to have UA optimize the parameters for your chosen outcome. A message may display warning you of a potentially lengthy wait. A highly involved optimization study (one with many parameters using a broad range of possibilities) could take days!

Depending upon the language of the study you have chosen, your screen may display a progress bar or, if the study was run in the Perl language, the computer screen will blink or show you the progress.

When a chart optimization is complete, UA proceeds with the analysis and displays the chart and study using the newly optimized parameters. You can view numerical values by clicking the [Table] tab at the bottom of the graphics screen.

When a MarketScanner optimization is complete, the scan set is evaluated based upon the optimized values and a new column is added to the MarketScanner spreadsheet. You may then sort and filter these results as desired. these functions are described in the MarketScanner chapter.

Preserving Your Optimized Results

When the study is complete, you will be asked if you want to save the new values. Optimized values are usually customized for individual markets. For example, your optimized values for corn would likely not be the best parameters for gold or bonds. Although you can automatically edit the program code to included the optimized results, it is probably best to keep a list of optimized values for each study with its corresponding market. You can then insert the appropriate parameters as needed. Alternately, you can re-optimize with each use.

If you decide to save your changes, the expression on your Study Toolbar and in the Study Library will be changed to reflect the optimized values.

Viewing the Optimization Report

UA produces a report of results for each variable tested, which is viewed through the charting right-click menu. See the "View System Optimization Report" topic. We also recommend you check out the "View System Performance Statistics" feature offered from the Right-Click menu. You can change the scale from the study's values to the value of your equity by choosing "Prefer System Equity Scale" from the Right-Click menu.