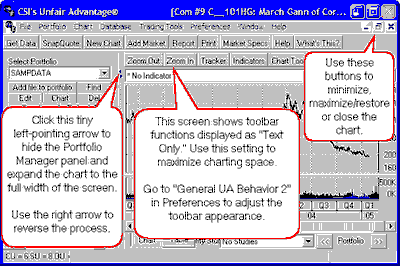
The entire UA screen is expandable as explained in this graphic:
You may add to or delete from the left and right screen areas by moving the common partition. To view more elements of the portfolio, either click the tiny right-pointing arrow on the divider between the Portfolio Manager panel and the charting window, or drag the divider bar to the desired location with your mouse. To do this, hold the mouse button down while dragging the divider to the desired position. Release the mouse button to drop the divider in place. The screen will present like this:
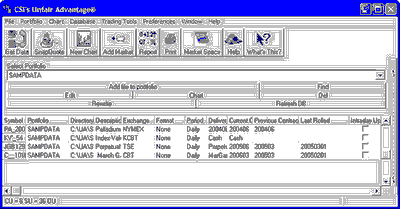
Use the same dragging technique to change the column width within the portfolio listing. You must grab the dividers in the header row at the top of the columns.
You may expand the chart area by clicking the tiny left-pointing arrow on the divider between the chart and the Portfolio Manager panel or by placing your mouse on the divider and dragging the boundary to the left:
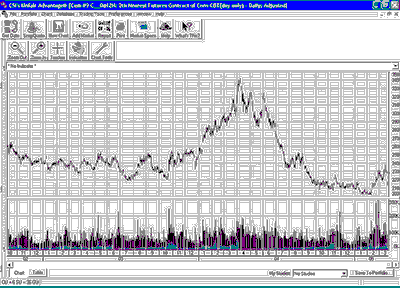
Charting Windows
The default presentation of a UA chart allows multiple charts to be cascaded, while still showing the title bar of each. When multiple charts have been selected for charting, or after a second chart has been displayed, you can display multiple charts simultaneously.
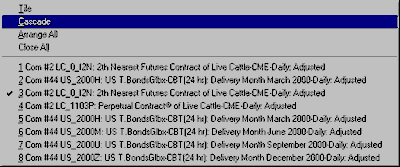
You may select the way multiple charts are arranged on your screen by clicking on your choice from the pull-down WINDOW menu as shown:
This menu offers you choices of presentation, plus a list of all charts that are currently available for charting. These are charts that you have just viewed, as well as charts that have been created and have not yet been viewed. The maximum number of charts included here is determined by the Memory Cache Size setting on the Advanced 1 screen of General Program Settings of UA Preferences. This number typically does not exceed 12.
Tiled
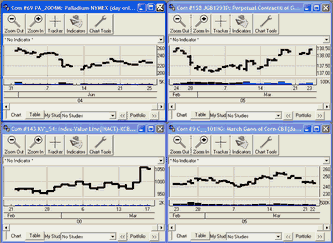
Below is an example of tiled charts. UA will attempt to display all available charts on the same screen, so this presentation works best with four or fewer charts available.
Cascaded
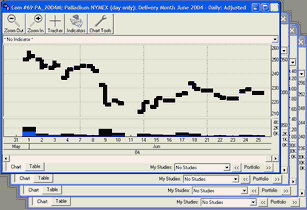
Below is an example of cascading charts. In the cascaded form, the last contract created is on top of the pile of charts.
Use these standard Windows buttons found at the upper right of each chart to minimize (left button), resize to full or partial screen (middle button) and close (right button). Click on the border of any chart to bring it to the front of the pile for viewing.
When a chart is minimized, UA creates a clickable button (see below) at the bottom of the screen identifying the data series. Double-click to restore the chart, or click once for various charting options.
Changing Colors
You can adjust the colors of the background and studies on your chart through the right-click menu as described in the "Change Color Scheme" topic.