The main benefit of having a Study Toolbar is that it allows you to create and customize a list of studies that you wish to use on a regular basis.
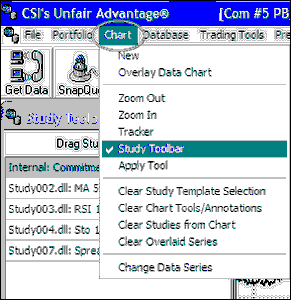
 The Study Toolbar is essentially a "Favorites" menu. Get there by clicking the "Indicators" icon on the UA tool bar or by clicking "Study Toolbar" from the Chart menu:

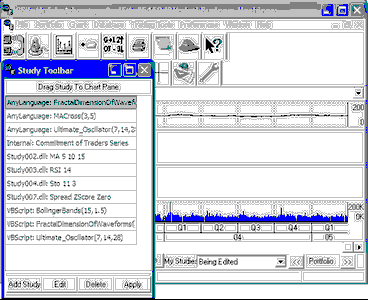
This brings up the Study Toolbar as shown here:

The toolbar shown above has been customized with several studies. As you can see, this example includes some internal DLLs which are provided initially, as well as studies in AnyLanguage (CSI's own programming language) and VisualBasic (VBScript). Each of these listings includes the selected parameters for study input.
The Study Toolbar offers four possibilities as described throughout this chapter.
Apply Study - To apply any of the listed indicators to your current UA chart.
Add Study - To customize the list with included or self-written indicators.
Edit Study - To change the parameters or even programming code for a currently listed study
Click the appropriate link (above) for instructions.
Delete Study