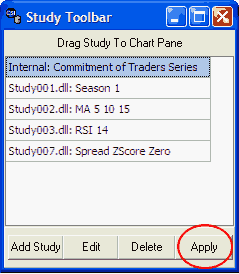
If the study you wish to perform is listed on the toolbar, select it from the menu (click it) and then click the [Apply] button. You'll be asked to pick a pane for applying the study with this box:
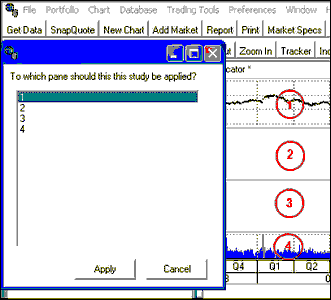
As shown in the above example, the panes apply to windows within your UA chart:
| · | If you want the study superimposed with the bar chart, select pane 1. UA will redraw your chart as before, with the bar chart and study sharing the main charting pane.
|
|
|
| · | For pane 2 or 3 (currently empty), click 2 or 3, respectively. If these panes are selected, UA will re-draw your charting window with extra panes holding just the study data.
|
|
|
| · | To show your study in the lowest pane along with volume and open interest data, select 4.
|
Click [Apply] to enter your choice.
This will start the analysis process. The study will be performed on the maximum amount of historical data available to the system at the time of your study, subject to limitation for AnyLanguage on the Charting Preferences screen of UA Preferences. Your historical database may be restricted to a subset of the full CSI historical database, depending upon your CSI subscription type.
The study will display in the selected charting pane, with the Study Toolbar and all four panes still visible.
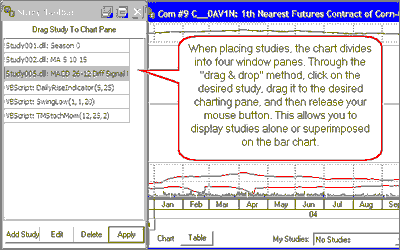
The "Drag & Drop" technique:
An alternate way to select and apply a study is to click your mouse on any listed study and (while still holding down the mouse button), drag the study to a pane on your chart. Release your mouse button in the desired pane to begin the analysis. The resulting chart will display as described above.
Adding More Studies
If you wish to add more studies after your first choice has been calculated, repeat the selection process. You may add multiple studies to any chart and to any pane. Be aware of chart scales for best results when choosing studies.
Restoring the Full Charting Screen
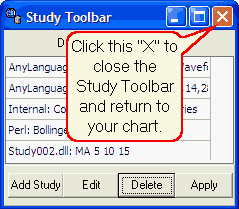
When you have finished adding studies, click the "X" at the upper right corner of the Study Toolbar:
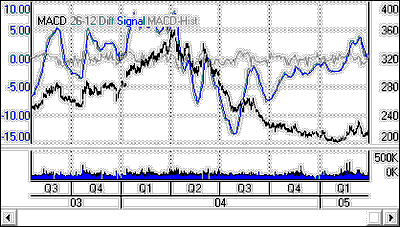
A study done in Pane 1 (with bar chart) will look something like this example of a moving average convergence/divergence study.
If the study you want to add is not listed on the Study Toolbar or if you want to change the study before applying, you may:
| · | Add Study
|
| · | Edit Study
|
Click the link (above) for instructions.