Historical Adjustments
|
Previous Top Next |
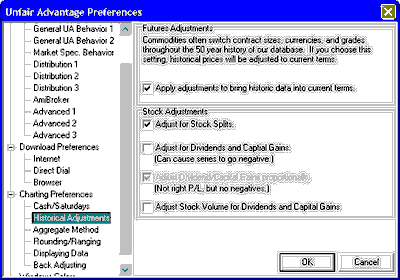
· | Splits - The split ratio is applied to historical pricing so that historical data is in line with current valuations. For example, a split-adjusted chart of IBM stock shows a considerably higher valuation now (near $100/share) than in 1965 (near $7/share). This accurately reflects growth that might otherwise be disguised by stock splits. Without split-adjustments, IBM shows a very sporadic price history and a closing price on 1/4/1965 of over $400/share. Although that was the actual price at the time, the valuation does not correspond with today's pricing. Adjusting for Stock Splits is recommended.
|
· | Dividends and Capital Gains - Like stock splits, dividends and capital gains distributions can obscure actual stock growth. The adjustment subtracts dividend and capital gains distributions from historical stock prices, with cumulative effects. As noted, the subtraction of all dividends and capital gains can cause historical series to sink below zero. Note that negative values can cause errors in some analysis and charting programs.
|
· | Adjust Dividend/Capital Gains Proportionally - This choice becomes available only when adjustments are requested for Dividends and Capital Gains (above). Proportional adjustments are made by reducing the price of the stock by the proportional value, rather than the actual dollar value, of the dividend or distributions over time. The result is a series that will not go negative, but which will not reflect actual dollar value of dividends and capital gains.
|
· | Adjust Stock Volume for Dividends and Capital Gains - This feature allows you to see the impact of dividends and capital gains on daily trading volume. It is available only when both of the above Dividend and Capital Gains choices are implemented.
|