Begin by clicking "New Chart" icon on the UA toolbar or by selecting "New" from the "Chart" menu.
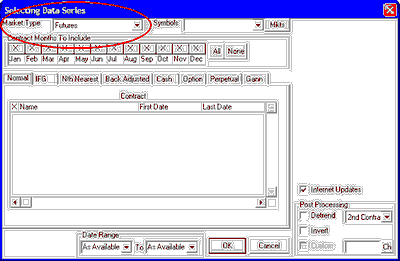
The "Selecting Data Series" screen displays:
|
Futures Charts
|
Previous Top Next |
| · | Normal Futures Contracts
|
| · | Individual Futures Group (IFG)
|
| · | Nearest Futures (Nth Nearest)
|
| · | Back Adjusted
|
| · | Cash
|
| · | Option
|
| · | Perpetual
|
| · | Gann
|


| · | Symbols entered must match the selected "Market Type."
|
| · | Symbols must be separated by a comma, a space or both, as shown in the above example. Here we show a request for charts of CBT Corn (c), NYMEX Heating Oil (HO) and CME Eurodollars (ED).
|
| · | An alternate way to identify the futures for charting is to enter the CSI number, such as 9 for Corn. CSI numbers can be found in the Market Specs Factsheets.
|
|
|
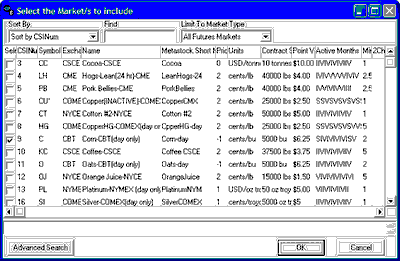
| · | All Futures Markets
|
| · | North American Futures
|
| · | Foreign Futures
|
| · | Domestic Stock Index Futures
|
| · | Futures With Options
|
| · | Single Stock Futures
|
| · | Narrow Based Index Futures
|
| · | Exchange Traded Fund Futures
|
| · | CSI Number
|
| · | Symbol
|
| · | Exchange
|
| · | Name
|
| · | MetaStock Short Number
|
| · | Price Format
|
| · | Units
|
| · | Contract Size
|
| · | Point Value
|
| · | Active Months
|
| · | Minimum Tick
|
| · | Two-Character Symbol
|
| · | Currency
|
| · | Option Start Date
|
| · | Option Strike
|
| · | Option Price Format
|
| · | Market Type
|
| · | Market Group
|
| · | Single Stock Future
|
| · | Average Total Volume
|
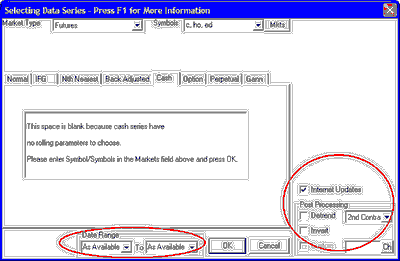
| · | Second Contract - Select to detrend the portion of the series that lies earlier than the final (most current) contract segment of the adjusted series.
|
|
|
| · | Second Day - Select to detrend right up to the day before the current day of the final contract.
|
| · | Open price = 1/Open
|
| · | High price = 1/Low
|
| · | Low price = 1/High
|
| · | Close price = 1/Close
|
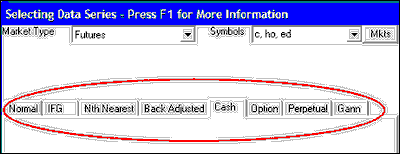
| · | Normal Futures Charts
|
| · | IFG - Individual Futures Group Charts
|
| · | Nth Nearest Future Charts
|
| · | Back-Adjusted Charts
|
| · | Cash Charts
|
| · | Futures Option Charts
|
| · | Perpetual Contract(R) Charts
|
| · | Gann Contract Charts
|