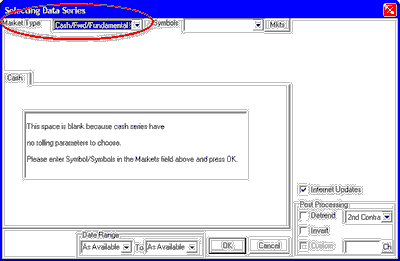
The "Selecting Data Series" screen displays, allowing you to select one or more data series for charting:

Market Type
|
Cash/Fwd/Fundamental Charts
|
Previous Top Next |


| · | Symbols entered must match the selected "Market Type."
|
| · | Symbols must be separated by a comma, a space or both, as shown in the above example. Here we show a request for charts of 180-Day and 360-Day T-Bill rates.
|
| · | An alternate way to identify cash series for charting is to enter the CSI number, such as 2101 for the 180-Day T-Bill rate. CSI numbers can be found in the Market Specs Factsheets.
|
|
|

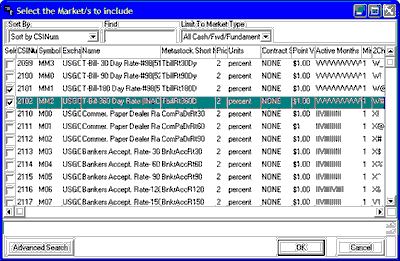
| · | All Cash/Forward/Fundamentals
|
| · | London Forward Metals
|
| · | FOREX - Currencies
|
| · | Interest Rates
|
| · | Commitments of Traders
|
| · | Economic Statistics
|
| · | General Cash Series
|
| · | CSI Stock Industry and Sectors
|
| · | CSI Number
|
| · | Symbol
|
| · | Exchange
|
| · | Name
|
| · | MetaStock Short Number
|
| · | Price Format
|
| · | Units
|
| · | Contract Size
|
| · | Point Value
|
| · | Active Months
|
| · | Minimum Tick
|
| · | Two-Character Symbol
|
| · | Currency
|
| · | Option Start Date
|
| · | Option Strike
|
| · | Option Price Format
|
| · | Market Type
|
| · | Market Group
|
| · | Single Stock Future
|
| · | Average Total Volume
|


|
|
|
|