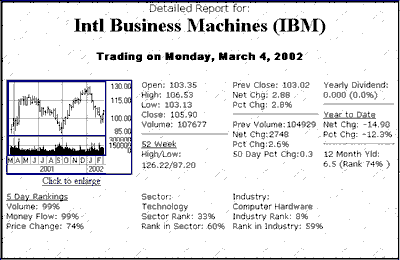
For a commodity, click the arrow next to "Stock" and then select "Commodity" from the drop-down menu. Then type the commodity symbol and click [Get Chart]. Once the chart is displayed, clicking the "More Details" button will bring up the following screen:

When a commodity is selected, a continuous data series appears that was calculated as back-adjusted contract using Open Interest for the roll trigger and the close-to-close accumulation method. See the Back Adjusted Overview topic under "Adding Editing Files/Contract Selection" in this manual for details on this type of data file.
To view another chart, use the [Get Chart] dialog again. You'll find it in the lower left portion of your screen. Enter a new symbol or click [Back] to return to the previous screen.