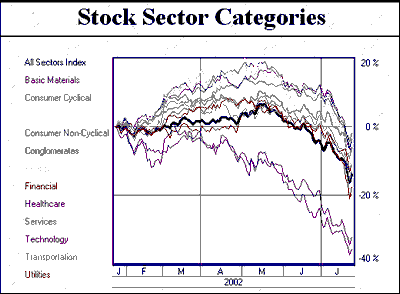
Click the [By Sector] (Stock) button on the left-hand side of the Daily Market Report to view a graphic view of stock sector movement.

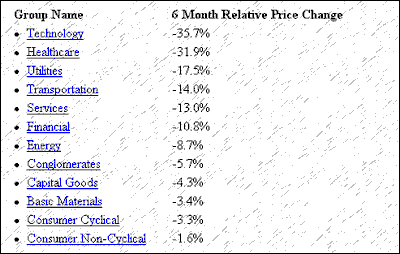
The chart is followed by a table showing a list of sectors and their six-month relative price changes:

Click on the sector you wish to view. The resulting screen offers the many stock categories included in the selected group, along with the six-month yield for each. For example, the "Healthcare" category includes Biotechnology & Drugs, Major Drugs and Healthcare Facilities.
Click on your choice of categories to display the list of included stocks. The names of the stocks and the six-month yield for each are shown. Click on a stock name to display a chart and detailed report.

