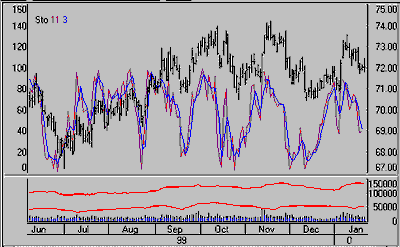
Two lines are used in the stochastic process. One, called the K line, which is usually presented as a solid line, indicates, on a percentage basis, the relationship of recent closes to the price range. The second line, called %D and usually presented as a dashed line, represents a three-day moving average of the K line. The %D line is similar to the K line, but is considered to be a dampened indicator. Think of the K line as a measurement of price velocity and the D line as a measurement of price acceleration.
 To add a Stochastic study to any price series, make your chart, click the "Indicator" button on the toolbar, and then select "Stochastic."
Alternately, pull down the Chart menu, click "Study Toolbar" and then select "Stochastic."
%K and %D
K - Enter the sample period. If, for example, you are using a daily chart, the default response of 11 indicates that the study looks for the relationship of closes to the range in eleven-day periods. If the same value were used on a weekly chart, the study period would be 11 weeks.
%D - Enter the period to use for the moving average which dampens the K results.
We use a simple stochastic, as opposed to weighted or exponential. The formula we apply produces a "fast" stochastic, as further dampening is not permitted. An example follows:

Interpretation:
In general, trading opportunities are based on divergence between price and the %D line. Actual signals are indicated when the divergence between price and the %D is followed by the crossing of the K and %D lines. A buy signal is generated when the dashed %D line crosses below the solid K line. A sell signal is generated when the %D line crosses above the K line.
Traditional thought holds that buy signals are considered most significant when they occur at index levels between 5 and 15. Sell signals are most significant when they occur at index levels between 85 and 90. Crossings are considered more significant if both lines are moving in the same direction.
Stochastics have a tendency to give sell signals while a market is still rising and buy signals while a market is still falling. For this reason, it has been suggested by several analysts that stochastic signals be used only in the direction of the current trend.
This indicator was developed by Dr. George C. Lane. He discusses this indicator in the June, 1984 issue of Technical Analysis of Stocks and Commodities. It is also included in many general books on technical analysis.