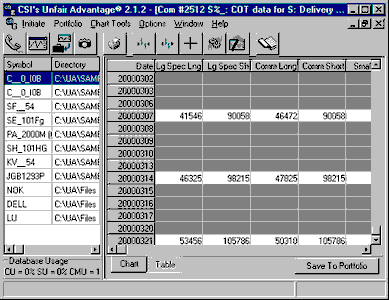
Many successful traders rely on Commitments of Traders data to keep tabs on the market interests of larger traders and hedgers, whose activities often influence future price performance. We are very pleased to offer a Commitments of Traders Data feed on 63 commodities as part of the CSI database.
Our data set includes Steve Briese's index computations, as well as the CFTC's raw released information with, in some cases, adjustments for obvious errors in the CFTC' s report. These bi-weekly reports are available every Tuesday with any corrections for the earlier week and the new government computed statistics on alternating Tuesdays.
Commitment of Traders data and The Briese COT Index are part of CSI's "Miscellaneous" database, where they can be analyzed and viewed as individual time series. The Briese Commitments of Traders Index can also be displayed as a study on any UA chart of the corresponding commodity's price series.
To add these data to a portfolio or make a chart of COT data as an independent series, begin as you would for creating any chart as explained in the "Creating a Chart" topic. Select any market type and then click the [Mkts] box next to the "Markets" box at right. This will bring up the market selection screen. Click the down arrow in the "Market Type" box at right, which will drop down a menu of any type of data. Scroll down to Commitments of Traders and click. The corresponding markets will display.
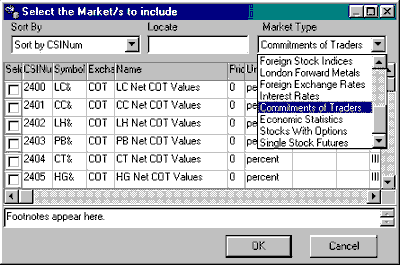
Note that CSI offers two series for each of the 63 covered commodities. The symbols for the Briese COT Index series end in the "&" character (shown above). These are followed by the raw COT data, whose symbols end in the "%" character. Scroll through the list to see all available COT series.
Select any of the COT or Briese COT Index series you wish to chart or add to a portfolio, and click [OK]. The subsequent screen shows that no additional input is needed for this series (it is automatically "cash"), but you may select additional file formats and periodicity (weekly is preferred, but not essential) as desired. Click [OK] when all your requirements have been selected.
Briese's COT Index will present in values from 0 to 100; Standard COT data presents as a very broad range of values.
Chart Presentation
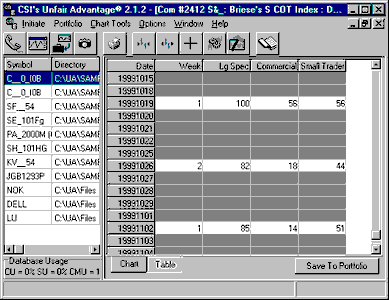
As these are weekly values, the default presentation in UA charts is as a weekly chart. You may change this as desired.
Use the chart crosshairs with readout feature or click the [Table] tab at the bottom of the chart for help in interpreting the chart values.
Click the [Add to Portfolio] button at the bottom of your chart to include this series in a portfolio.
File Format for Briese's % COT Index
These files use a standard price format - comma delimited, 7 field ASCII, suitable for importing into spreadsheet or graphing software. Briese %COT Index files are named with "COT" followed by the commodity symbol (e.g. Soybeans is "COTS.PRN").
The field substitutions are as follows:
DATE DATE
OPEN WEEK*
HIGH LARGE SPECULATOR INDEX
LOW COMMERCIAL HEDGER INDEX
CLOSE SMALL TRADER INDEX
VOLUME ZERO**
OI ZERO**
*WEEK Since 2 weekly reports have been issued on alternate Fridays since 10-6-92, the WEEK field is used to determine if the data is (1) the current week or (2) one week old. This would be important if the data were used in system trading, since the week old data would not be available any earlier than the current week's data. In general, you can assume that data with a WEEK code of 1, was available approximately 1 week after the compilation date carried in the DATE field. WEEK = 1 IF LATEST REPORT; WEEK = 2 IF REPORT IS 1 WEEK OLD
** ZEROS are carried for Volume & Open Interest fields to facilitate importing into graphing packages as 7 field ASCII.
The calculation for Briese's Index is proprietary.
Unfair Advantage Example:
Soybeans COT Index file # 2412
19991026 Week 2 large speculator=82, Commercial=18, Small Trader=44
File Format for CFTC COT Data These files also use a standard price format - comma delimited, 7 field ASCII, suitable for importing into spreadsheet or graphing software. Futures Only Commitments of Traders Data files are named with the symbol preceded by the letter "q" (e.g. Soybeans is "QS.PRN"). The futures + options data files are preceded with the letter "u" (e.g. Soybeans is "US.PRN"). The format for both files is identical:
DATE DATE
OPEN LARGE LONG
HIGH SPECULATOR SHORT
LOW COMMERCIAL LONG
CLOSE HEDGER SHORT
VOLUME SMALL LONG
OI TRADER SHORT
COT Data file for calculating above COT Index
For more information on C.O.T. data and their use, you might want to subscribe to Steve Briese's Bullish Review (phone 888-423-4950). Every two weeks, Steve reports on dozens of government-regulated commodity markets. He supplies charts of market behavior, inclusive of his index, and commentary on future price performance prospects derived from the COT data.