Charting Preferences
Previous  Top  Next

Charting preferences are settings that you may adjust to assure that your charts meet your needs. To reach Chart Preferences, click "Preferences" from the main menu at the top of your screen.

prefpick


Next click "Charting Preferences" in the left panel as shown below:
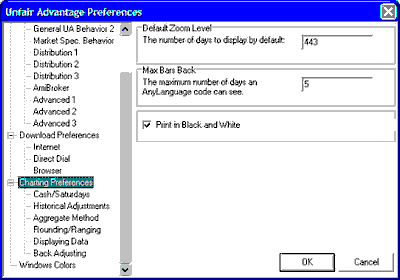
selchtpre

You can view and adjust the following settings on the Charting Preferences Screen (shown above).

Default Zoom Level


UA's Default Zoom Level feature lets you specify how many price bars will display automatically on your charts, thus controlling the time period displayed. The higher the number, the more compressed your charts will be. The lower the number, the more space will be between bars.

Regardless of your entry here, you may change the spacing of price bars on your UA chart through the "Zoom Out" and "Zoom In" icons on the chart toolbar or through the Zoom by Box feature on the toolbar. You can also save whatever is your current zoom level through the right-click menu's "Save Current Zoom Level" feature.

Note that this feature governs all UA charts, whether created from a portfolio or created through the "New Chart" icon.

Max Bars Back

This prompt applies to studies developed in AnyLanguage, a unique and flexible programming language invented by CSI for market analysis. AnyLanguage studies can be run within UA through either Interpreted Studies as part of the standard charting module, or through MarketScanner. If you'll be doing custom analysis with AnyLanguage, then consider the maximum number of price bars your study will need as input. Lower numbers reduce compute time; higher numbers give access to more data. Enter your selection here.

Print in Black and White

UA creates charts in color on your screen. These print in grayscale if you have a one-color printer or in full color on a color printer. If you have a color printer and prefer to print all charts in black and white (grayscale), check this box. This will save you time and money if color isn't necessary on your charts.

Other Chart Preferences


Additional Charting Preferences screens offer several functions that affect new charts created through Unfair Advantage. They are:

On the Cash/Saturdays screen:
·Retrieving Cash Prices  
·Including Saturdays  
·Compute Total Volume and Open Interest  

On the Historical Adjustments screen:
·Futures Adjustments  
·Stock Adjustments  

On the Aggregate Method screen
·Computation of Volume for Weekly/Monthly Charts  
·Computation of Open Interest for Weekly/Monthly Charts  
·Interpretation of Cash Prices for Weekly/Monthly Charts  
·Assigning Dates to Weekly/Monthly Charts  

·Rounding/Ranging  
·Displaying Data  
·Back Adjusting  

A General Program Settings from your UA Preferences that also affects charts is:

·Memory Cache Size  

When charts are created from files listed in any of your UA portfolios, some settings that affect your charts are controlled through the portfolio settings screen. To adjust these settings, first select the desired portfolio, then go through the Portfolio menu to "Edit Portfolio Settings." From there you may select preferences that will apply to the entire portfolio. The portfolio settings include additional preferences for export files that are not addressed here.