Cash/Fwd/Fundamental Charts
Previous  Top  Next

Creating a cash, forward or fundamental chart is easily done with Unfair Advantage. Begin by clicking "New Chart" icon on the UA toolbar or by selecting "New" from the "Chart" menu.

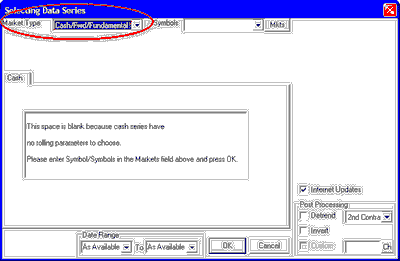
The "Selecting Data Series" screen displays, allowing you to select one or more data series for charting:
selectcash


Market Type


As shown in the above example, the "Market Type" must be set to "Cash/Fwd/Fundamental Series". If this doesn't show on your screen, click the arrow at the right side of the box to drop down the menu and make your selection as shown here:

pickcash


Symbols

Now you may identify the cash, forward or fundamental series you wish to chart. If multiple selections are to be handled in exactly the same way, you may chart them together, subject to the charting limit specified as Memory Cache Size in UA Preferences.

If you know the symbols of the series you want to chart, type them into the "Symbols" box. If you don't know the symbols, which is likely because they are not standardized in the industry, or if you prefer not to type them, click the [Mkts] button at the right of the "Symbols" box so that you may Choose Symbols From a List as described below.

cashsym


·Symbols entered must match the selected "Market Type."  
·Symbols must be separated by a comma, a space or both, as shown in the above example. Here we show a request for charts of 180-Day and 360-Day T-Bill rates.  
·An alternate way to identify cash series for charting is to enter the CSI number, such as 2101 for the 180-Day T-Bill rate. CSI numbers can be found in the Market Specs Factsheets.  
 
Choosing Cash/Forward/Fundamentals From List


You may choose markets from a list by clicking the [Mkts] button at the right of the "Symbols" box. The CSI Market Specs Factsheet that corresponds to the selected "Market Type" displays. You can begin every new chart directly from this screen (instead of the Selecting Data Series screen) by choosing "In Data Series Manager, choose market from Market Stats List" on the General UA Behavior 2 preferences screen.

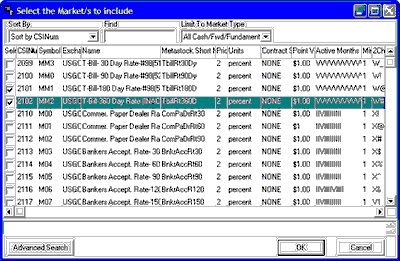
The example below is for Cash/Forward/Fundamentals. To choose from the list, click the box(es) under the "Sel" (select) heading for each market you wish to chart, and then click [OK].

mktspeccash


The following features of this screen may help you in your selection:

The Limit to Market Type box at the upper right will further classify the data to ease the selection process. Click the arrow at the right to view all possible market categories and make your selection. The choices that apply to Cash, Forward and Fundamental series are:

·All Cash/Forward/Fundamentals  
·London Forward Metals  
·FOREX - Currencies  
·Interest Rates  
·Commitments of Traders  
·Economic Statistics  
·General Cash Series  
·CSI Stock Industry and Sectors  

Only those market types within your subscription category will be available to you on the Market Specs factsheet.

The "Sort By" box is found at the top left of the Market Specs screen. Click the arrow at the right side of this box to drop down a menu of sorting choices. Secondary sorting and delisted markets will display as identified on the Market Specs Behavior screen of UA Preferences. The "Sort By" keys that are available for cash, forward and fundamental data are:

·CSI Number  
·Symbol  
·Exchange  
·Name  
·MetaStock Short Number  
·Price Format  
·Units  
·Contract Size  
·Point Value  
·Active Months  
·Minimum Tick  
·Two-Character Symbol  
·Currency  
·Option Start Date  
·Option Strike  
·Option Price Format  
·Market Type  
·Market Group  
·Single Stock Future  
·Average Total Volume  

The obvious benefit of selecting a sort key is that you can pick the identifier you know to quickly find markets of interest. For example, if you know the symbol, but not the CSI number, you can choose "Symbol" as the sort key and then easily scroll to or use "Find" (below) to reach your desired symbol in the sorted list. Likewise with name, exchange, etc.

An alternate method for selecting the "Sort By" field is to click the heading at the top of the desired column. For example, to sort by name, click the "Name" cell at the top of the table. To reverse the sort order, click the heading again.

Find - Use this in conjunction with the "Sort By" key. Once you have selected the sorting key, enter the identifier you wish to find here. For example, if you are sorting by symbol, enter the desired symbol in the "Find" box. If you are sorting by CSI number, contract size or other numerical value, enter the number here. UA will locate and display your choice in the Market Spec factsheet.

If the "Find" feature does not reveal the market you desire, try the "Advanced Search" described below.

Footnotes


Be sure to check the footnotes at the bottom of the screen see if important information is available for your selected market. Click the market once to activate the footnote function.

Advanced Search

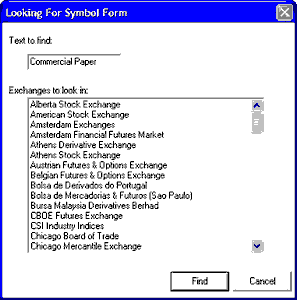
The "Advanced Search" feature is very useful in seeking cash, forward and fundamental data, which may be obscured through non-standard naming conventions. Unlike the "Find" feature shown above, which searches only on the beginning letters of the search string, the advanced search looks for your search string within the full description. If "Find" doesn't turn up your desired market, click the [Advanced Search] button at the bottom of the screen, to display the form shown here:

advancedfind


Text to find:


Enter the name or description of the market you wish to find in the "Text to find" box. For this example, we entered "Commercial Paper" to find these important fundamental series. The results are shown below.

You may also fine-tune your search by selecting an exchange or exchanges from the list. This is not necessary, however.

Click [Find] to start your search.

Choose Matching Market

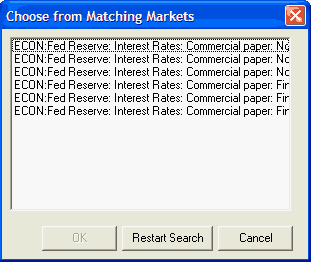
UA will display all the markets holding the search string you entered, as in the example below for "Commercial Paper." Click the one(s) you wish to select and click [OK].

Click [Restart Search] if your choice isn't shown and try again with a narrower search criteria.

advancedfunds2

The Market Spec factsheet will re-display with your selection visible. Click your choice(s).

When the desired markets have been selected, click [OK] to return to the Selecting Data Series screen, where you can complete your chart specifications as described next.

"Cash" Selection
 
Click the "Cash" tab in the center region of the screen (see top example). This enters your symbols without submitting the full selection screen. UA will confirm that your symbols are valid and display the corresponding CSI number for each.
 
Internet Updates


Although the right-hand panel of the Selecting Data Series screen includes an "Internet Updates" setting that is automatically checked, these fundamental series are not typically available for intraday update via SnapQuote. Please disregard for this series.

Post Processing


Also in the right-hand panel is the "Post-Processing" box that offers two features for manipulating your data. These are referred to as "Post processing" because the processing occurs after the data is retrieved from your files, but before charts are displayed.

Detrend - Detrending is a manipulation that attempts to remove long-position biases and other distortions that can occur in long-term analysis by transforming all historical data into today's terms. It can be a useful procedure for all types of continuous files, but is typically used more for futures, which are more subject to distortions, than for cash and fundamental series.

For cash, forward and fundamental series, the detrending approach always focuses upon the very first (most distant) day of the historical series and the day before the last day in your series. This determines a precise interval on the y price axis. The number of trading days that transpired from the first (most distant) point and the chosen end point determines the number of units (days) by which the entire series will be elevated or decreased, as the case might be, and leads to the slope calculation.

If Detrending is desired, check the box. When offered the choice of Second Contract or Second Day for the calculation, select Second Day. This is the only valid response for this application.

Invert - Chart Inversion is a post-processing feature that allows you to view or analyze market data from an alternate perspective. It is used almost exclusively for comparing correlated currency markets. Inverted prices are significantly distorted in both raw values and market direction. This feature in NOT appropriate for most markets. Inversion should only be used judiciously and with care.

Date Range

The default start and end dates are "as available," which incorporates all available data into the current chart. If you want a later start date or earlier end date, click the appropriate box and type the desired date.

The required format is an eight-digit numerical value consisting of the four-digit year, two-digit month and two-digit day, with no commas, slashes, dashes or spaces. For example, March 5, 2004 would be entered as: 20040305.

Click [OK] to display your chart(s).


See the Chart Interpretation & Manipulation chapter for information on interpretation and manipulation. Consider using the "Save to Portfolio" feature to save your charts for future use.