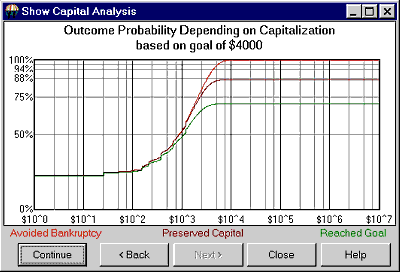
The Outcome Probability vs. Capitalization chart shows the substance of the overall TSPE results. You might want to zoom in (as in the example using a right mouse click) to improve the visual resolution of the chart curves.

Study the chart carefully before deciding to risk your valuable capital in pursuit of a predetermined goal.
The Capitalization chart offers a fixed horizontal scale (logarithmic) that ranges from an invested capital of one dollar to as much as $10,000,000. The vertical scale shows linear probability that ranges from zero (no chance of goal achievement) to 1.000 (a 100% chance of goal achievement). The curves are drawn through a Monte Carlo simulation of your situation as determined from the inputs supplied. TSPE will display the exact x,y coordinates for the location of your cursor. This lets you use your mouse to clarify the values for the vertical scale showing linear probability and the horizontal scale showing your invested capital.
The mouse position on the screen defines probabilities as a function of the selected invested capital. Once a coordinate is identified, you will immediately know the capital level required to achieve the goal (also shown in the chart heading) at the probability identified. The probability intersection points for the three curves on the y axis are identified as follows: "With capital of $5,300, a goal of $4,000 within 30 trades yields a win prob of 70.1%, a breakeven prob of 86.9%, and some capital left prob of 96.3. Please note that the number of trades supplied to the system affects the probability of winning, but that the residual capital remaining in your account is not lost. In effect, this is the probability of Marginal Performance (13.1% for the above example), as explained above.
Chart Legend:
BANKRUPTCY: The top curve in the above Capital Analysis chart shows the chance that drawdown will be any given number of dollars or less (see horizontal scale). The chance that drawdown will exceed the dollar value reading of the horizontal scale is 100 minus the vertical scale reading.
CAPITAL PRESERVATION: The middle curve shows the probability of recovering the original capital stake (shown on the horizontal scale). Saying it in another way, given that we started with the horizontal scale reading, the chance that the account holds that balance or more is shown on the vertical scale. This curve represents the required probability for any given capital/goal level to return original investment capital back to the investor without interest.
GOAL ACHIEVEMENT: The vertical scale shows the probability that a given goal can be met with original capital intact (horizontal scale). This line represents the mean probability of reaching your stated goal at all capital stake levels. Low values indicate a low probability of reaching your goal and high values indicate a high probability of reaching that goal. The probability of reaching the goal normally increases as capital stakes are increased. The closer this curve gets to 1.0 on the vertical scale, the better the chance of achieving your goal with a given capital stake.
Please note that the TSPE chart curves represent sampled results, so they are not necessarily smooth and ever-increasing. TSPE is subject to sampling error. The solid line should be thought of as a reflection of a series of expected values. Read on for more about the Capital Stake Value.
