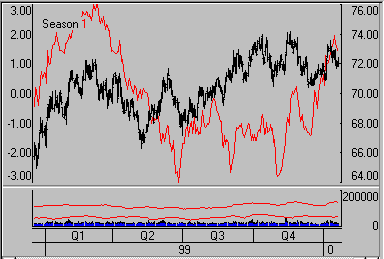
The seasonal index represents a + or - 3 sigma confidence interval over time. It reflects and reports upon the entire history of the series given as input in a cumulative manner. In the non-amplified form, the index is painted a day at a time as more input contributes to the seasonal pattern. The index may become more and more dampened as more information is supplied. There is no attempt to use the final year in the seasonal waveform to explain the past. In other words, the seasonal wave for of, say, a ten to 20 year series can be used as an input to forecast future events or simulate past events without bias where any then-current reading does not and cannot affect earlier seasonal patterns. Improved results may appear when longer term computed input is prepared using the "detrend" option.
 To add Seasonal Index data as a study to any continuous price series, simply make a daily chart of the underlying market, click the "Indicator" button on the toolbar, and select "Seasonal Index."
Alternately, pull down the Chart menu, click "Study Toolbar" and then select "Seasonal Index."
Amplify:
The only user-defined parameter in the seasonal index computation is amplification. This makes the seasonal waveform easier to conceptualize and amplifies seasonal effects. Unfortunately, by selecting amplification, the significance of the seasonal effects will be distorted because the measured significance of the sigma readings will be lost.
Here is an example of a Seasonal Index chart drawn from the detrended live cattle series (Upper Chart).

Don't attempt a seasonal index calculation unless your input time series holds more than one full year of data. When years of substantial history are supplied, the cumulative general waveform tends to prevail all of the time. The resulting waveform becomes more and more characteristic of the commodity as more data is processed. We recommend this study be performed on at least ten years of daily (not weekly or monthly) data. If a computed contract is used as input, it must not contain ANY negative values.
The suggested usage of seasonal indices is to look for coincident peaks and troughs between the market and the index. When peaks coincide or when troughs coincide, the risk of loss on a trading position should be at its minimum. For some traders this may translate into an opportunity to take a heavier position. It is not recommended that seasonal indices be used as the sole basis for trading. They should only be used in conjunction with other confirming market factors.