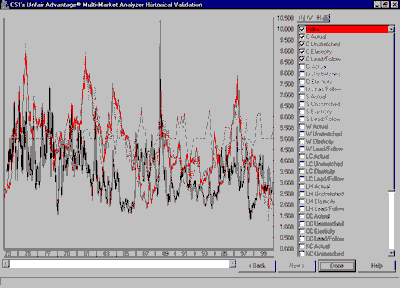
This screen is a very flexible chart screen. First, in the upper right corner, there are four buttons. The one on the left expands the scale of the chart horizontally. The next one compresses the scale horizontally; this button is inactive in this screen currently because the whole data period is displayed. The next button turns on a tracking crosshair, and the last one prints the current chart.
Below these buttons, you can select which variables you want to plot. "Index" at the top is the Stretch Index. Below that, the other indicators for each market are available. When the screen first comes up, the first market selected is displayed, so if you know going into the analysis that you are interested in a specific market, you can enter that one first.
If you want to do your own off-line analysis, Multi-Market Analyzer creates a file with all of the information in this screen. The file is called "mmanalyzer.csv" and is located in the main Unfair Advantage directory, usually "C:\UA". As the name suggests, the file is in comma-separated value (CSV) format and can be imported directly into most spread sheets, databases and statistical packages. For more information, see the Unfair Advantage Developer Document on CSI's web site.
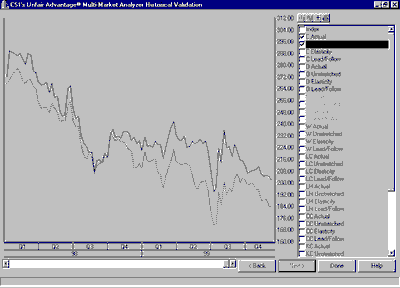
Let's look at a plot of corn versus its Unstretched Indicator.

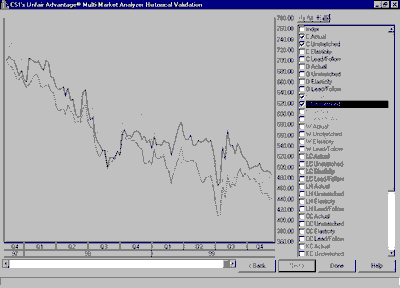
Except for a relatively brief period in 1998, for the past two years the Unstretched Indicator has been visibly below the actual price, indicating an overpriced condition as it does at the time of this writing (December 12, 1999). It should be noted that the turns in the Unstretched Index in this case are more or less coincident with turns in the price of corn itself. That is, there is no clearly visible lead or lag, so it does not appear to be a good predictor of corn prices by itself. Let's add in the soybean data, since we saw a potential long soybeans / short corn spread on the previous screen:

We can see that there have been a few times when corn and soybeans diverged visibly, but for the most part they moved together, primarily downwards in the past two years. The overpricing of corn relative to soybeans we see today began early this year according to this chart and corrected itself briefly around the beginning of the 4th quarter. Without knowing any of the other factors – fundamentals, seasonality and so forth – it would be risky to put on this trade based on the MMA indicators alone.
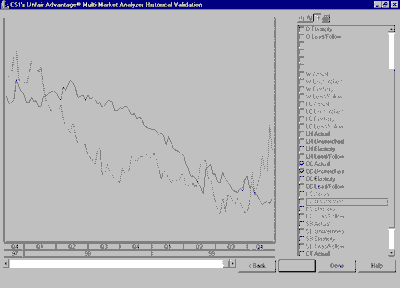
Let's look at one more chart, this time for cocoa (CC).

What is interesting here is that, unlike corn and soybeans, cocoa does appear to be led by its Unstretched Indicator. That is, upturns and downturns in the price are preceded by upturns and downturns in the indicator. Again, without knowing more, it would be risky to trade just on this basis, but a long CC position does appear to be suggested by this chart. Read on to learn more about developing a trading strategy.