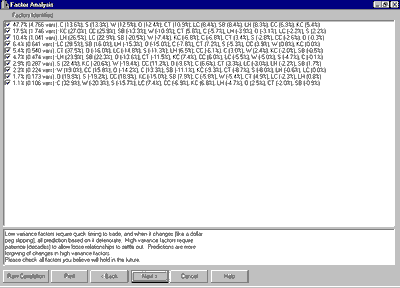
Factor analysis is a statistical technique that helps understand the structure of a set of variables and how they relate to each other. Suppose, for example, we had monthly returns of 500 stocks and wanted to simplify the data set. One way to do this is to assume that each stock return is a linear combination of factors. That is, each stock's return can be written as an equation
Ri = C1i * F1 + C2i * F2 + C3i * F3 + … + Cni * Fn
where Ri is the return of the i-th stock, C1i, C2i, etc. are the coefficients, n is the number of factors and F1, F2, etc. are the factors. Although it is possible to compute as many factors as there are stocks, in this case 500, the realities of economics are that the number of useful factors will typically be much smaller. Typically there will be one factor representing the overall market and one factor for each market sector represented in the stocks that were analyzed. One would then look at a table of factor loadings for the first few factors, see which stocks were most highly loaded in each factor, and from a knowledge of what those stocks had in common, gain understanding of what the factors mean.
In our example, instead of 500 stock returns we have chosen ten detrended futures contract prices. The factor loadings as computed by a statistical package are:

So factor 1 is very highly correlated with C, highly correlated with O, S, W and CT and moderately correlated with LC, LH, CC and SB. Factor 2 is highly correlated with CC and KC and moderately negatively correlated with SB. No more high correlations remain. Going to six factors exhausts the list of moderate correlations.
How should we interpret these factors? Factor 1 can be interpreted as being a proxy for the common supply and demand influences that affect most agricultural commodities, but especially corn, oats, wheat, soybeans and cotton. Factor 2 is very different from factor 1; it shows supply and demand influences on coffee, sugar and cocoa not captured by factor 1. Factor 3 shows supply and demand influences on live cattle and lean hogs not captured by the first two factors, and so on.
The mathematical process of factor analysis is very similar to what happens when an astronomer passes white light from a star through a spectroscope. The spectroscope shows a number of lines of varying color and intensity. In our case, the factors are the colors and the numbers in the left-hand column are the intensities. There are three ways we can use the factor analysis, depending on our trading approach:
We can just leave all the factors checked and go on with the analysis. This corresponds to using all of the information in the market data provided, and is usually what we do.
We can de-select some of the lower-intensity factors. They provide less information than the high-intensity factors. De-selecting them will reduce the amount of computer time needed to perform the remaining analysis at the cost of some accuracy. A rough rule of thumb is to go from bottom up, adding the intensities until the sum is somewhere between 5 and 10 percent. In this example, we would de-select the bottom three or four factors. This should only be necessary with a large number of input markets; the small case we are dealing with here does not require it.
If we were interested only in a specific market or pair of markets, we could de-select the factors that were only slightly loaded in those markets. For example, suppose we were interested only in sugar. Ignoring factors with slight loadings, less that 0.2 in magnitude, leaves factors 1, 2, 3, 4, 5 and 6. As with the previous case, we are trading slightly lower accuracy for reduced computing time and this is not necessary for the current example. It should be noted that using only these factors will give highly misleading results for any market except sugar.
In most cases, the default – leaving all factors selected – is appropriate and that is what we will do on this example. For more information on factor analysis, see [Williams1968], chapter 12 and [RaymentJoreskog1996. Once you have de-selected the factors you wish to ignore, if any, press the "Next" button to move to the current inter-market situation. Again, this may take some time as the Multi-Market Analyzer is computing proprietary indicators based on the factors selected.