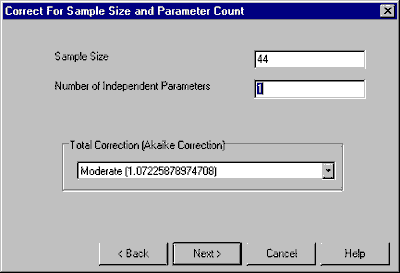
Sample Size: The sample size is filled in for you. It is the number of trades included in your track record. We recommend at least 50 P&L inputs. See "The Importance of an adequate sample size" in the discussion of The TSPE Model (in TSPE Overview).
Number of Independent Parameters: Generally speaking, a parameter is any restriction used to generate trading signals. Since each parameter adds more artificial control over a hindsight evaluation, TSPE compensates within reason for the artificially-inflated profits they produce in simulated trading.
When an actual trading record is analyzed, the number of parameters or restrictions used in generating signals has no relevance on the validity of the P&L string. We do assume that some user bias is included in all trade records, so the minimum accepted response of 1 should be entered here for an actual trading record.
Counting Parameters for Simulated Track Records
We expect that TSPE will be used most often to evaluate trading systems or programs that have been purchased. Most toolkit programs are loaded with parameters, so we've listed the parameter count for a few popular studies as examples below.
We hope these examples will help you learn to count parameters in your own trading systems. If you need additional assistance with this, feel free to contact the CSI service staff. They will record the pertinent information about your trading system and get back to you with a parameter count.
Examples of Parameter Counts
Public domain study Parameters Parameter description
RSI 1 Enter length of RSI?
1 Enter top threshold
1 Enter bottom threshold
Sum = 3
MAC/D 1 Enter MACD period 1
1 Enter MACD period 2
1 Enter signal period
Sum = 3
Stochastic 1 Enter period length?
1 Regular or slow?
1 Enter length of moving average?
Sum = 3
William's %R 1 Enter period length?
1 Top index value?
1 Bottom index value?
Sum = 3
The mathematician who does not use off-the-shelf programs may need to consider other factors in calculating the parameter input. If the analyst has a graphic chart of price history for the stock of General Electric, for example, one might conclude that a first degree equation fits the data very well. A first degree equation is a straight line.
Only two points sighted or fitted through the chart would exactly define the line. A straight line model takes one degree of freedom which is considered 1 parameter. A second degree equation polynomial) consumes two degrees of freedom, making the parameter count two. A third-degree equation consumes three degrees of freedom which would be counted as three parameters, etc.
Total Correction: This entry determines how conservative corrections will be when the software corrects results for likely forecasting error. This is simply an adjustment involving the number of parameters and the sample size that requires one of the following equations.
Click the symbol to the right of the selection box to drop down the following menu:

When applying any of these correction factors to a given positive P&L result, the positive profit is replaced by the given profit divided by the equation factor; negative profits are replaced by the product of the equation factor and the given negative profit. The generous and moderate selections use a technique known as the Akaike Correction, which is less severe than the CSI Correction used for the normal and conservative selections. The Akaike correction translates into a requirement of relatively less capital to meet a given goal than the CSI correction requires.
Make your selections from this screen, then click [Next] to view a graphic display of your P&L string (including TSPE corrections).
When a third party's Performance Summary suggests a profitable system, be aware that a winning simulation could easily deliver a substantially negative result in actual trading. Here's why: Every trading system is controlled by one or more parameters that, in a very real way, fit the data to the chosen system under study. Matching data with a technical remedy could force a non-repeatable circumstance because you, the developer, would allow the historical data to be analyzed against your personal study rules. Your choice of market or system could be based solely upon simulated performance results, which will pose a problem when excessive parameter control is innocently introduced.
A moving average crossover study requires two parameters: a short term moving average and a longer term moving average. Two-parameter systems are less likely than one-parameter systems to return a profit in real life. A less constrained one-parameter system example could be a breakout system, which will execute trades into an opposing long or short posture when the market moves out of a trading range. Your parameter consumption quantity reveals much about how your P&L string was prepared, so the mathematics can assess the validity of the profits and losses. In general, the fewer parameters, the better the anticipated result because TSPE imposes a disclosed penalty for excessive parameters.