Before creating a chart this way, you should understand the properties and limitations of the result:
| · | Charts will display as identified on the various Charting Preferences screens of UA Preferences.
|
| · | Stocks, Indexes and Cash/Forward series: Two-year chart of the series.
|
| · | Futures: Two-year chart of a back-adjusted series using the close-to-close differential for the adjustment value, based on the normal active trading months as shown in Market Specs. Please see the Back-Adjusted Contract topic for information on these settings. The roll-forward algorithm used to switch from contract to contract depends upon the back-adjuster specified on the Back-Adjusting screen of Charting Preferences:
|
| · | If "Use Only C++ Back Adjuster" is checked, the back-adjustment series will be generated forward and the series will roll from one contract to the next five days before expiration.
|
| · | If "Use Only C++ Back Adjuster" is NOT checked, the series will not be generated forward and will roll on Open Interest, subject to three confirmation days.
|
If the chart you wish to create is different from the limited offerings here, you can create more customized charts from scratch as described in the Creating New Charts chapter.
Here's how to proceed with charting from Market Specs:
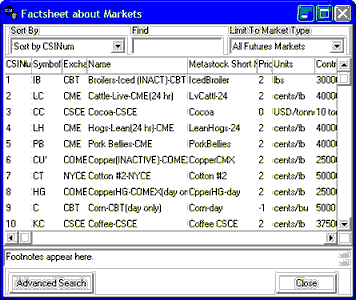
Open the Market Specification Factsheets
Click the icon from the toolbar:

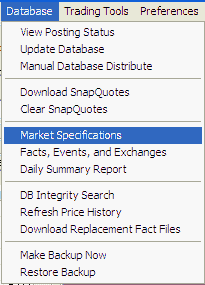
Or pull down the Database menu and select "Market Specs" as shown here:


When you find the desired market, double-click it to display a chart.
UA offers three keys for finding the market you wish to chart.
Limit to Market Type - This is the drop-down menu of choices for displaying data at the right side of the selection screen. Click the arrow at the right side of this box to drop down a menu of choices. You should make sure this is set to the appropriate market type before using the other search keys.
| · | All Stocks and Mutual Funds
|
| · | All Futures Markets
|
| · | All Cash/Forward/Fundamentals
|
| · | US Stock Markets
|
| · | Non-US Stock Markets
|
| · | World Stock Markets
|
| · | Mutual Funds
|
| · | North American Futures
|
| · | Foreign Futures
|
| · | Domestic Stock Index Futures
|
| · | Foreign Stock Indices
|
| · | World Stock Indices
|
| · | London Forward Metals
|
| · | FOREX - Currencies
|
| · | Interest Rates
|
| · | Commitments of Traders
|
| · | Economic Statistics
|
| · | Stocks With Options
|
| · | Futures With Options
|
| · | Single Stock Futures
|
| · | General Cash Series
|
| · | Narrow Based Index Futures
|
| · | Exchange Traded Fund Futures
|
| · | CSI Stock Industry and Sectors
|
| · | Stock Market Data Stored as Futures
|
Only those market types within your subscription category will be available to you on the Market Specs factsheet.
Sort By - The "Sort By" box is found at the top left of the Market Specs screen. Click the arrow at the right side of this box to drop down a menu of sorting choices. Secondary sorting and delisted markets will display as identified on the Market Specs Behavior screen of UA Preferences. The "Sort By" keys are:
| Futures or Cash/Forward Fundamental
|
| · | CSI Number
|
| · | Symbol
|
| · | Exchange
|
| · | Name
|
| · | MetaStock Short Number
|
| · | Price Format
|
| · | Units
|
| · | Contract Size
|
| · | Point Value
|
| · | Active Months
|
| · | Minimum Tick
|
| · | Two-Character Symbol
|
| · | Currency
|
| · | Option Start Date
|
| · | Option Strike
|
| · | Option Price Format
|
| · | Market Type
|
| · | Market Group
|
| · | Single Stock Future
|
| · | Average Total Volume
|
|
|
| Stocks/Funds/Indices
|
| · | CSI Number
|
| · | Symbol
|
| · | Exchange
|
| · | Name
|
| · | Price Format
|
| · | Start Date
|
| · | Stop Date
|
| · | Option Start Date
|
| · | Option Strike Dividend
|
| · | Option Price Format
|
| · | Sector Code
|
| · | Industry Code
|
| · | Earnings Per Share
|
| · | Shares Outstanding
|
| · | Number Institutional Shares
|
| · | Percent Institutional Shares
|
| · | Stock Beta
|
| · | Revenue Growth 5 Years
|
| · | Dividend Growth 5 Years
|
| · | Dividend Yield
|
| · | Price Earnings Ratio Average 5 Year
|
| · | Latest Annual Operating Revenue
|
| · | Price Earnings Ratio
|
| · | Has Fundamental Data
|
The obvious benefit of selecting a sort key is that you can pick the identifier you know to quickly find markets of interest. For example, if you know the symbol, but not the CSI number, you can choose "Symbol" as the sort key and then easily scroll to or use "Find" (below) to reach your desired symbol in the sorted list. Likewise with name, exchange, etc.
This vast array of sorting keys also allows you to begin the process of screening investments based on your choice of parameters. For example, you can use the "Average Total Volume" key to find high volume (highly liquid) markets for consideration. This is useful if you want to trade a commodity that is offered on several exchanges, but want to find the most popular. Alternately, you could sort by "Market Type" and then compare the different offerings.
An alternate method for selecting the "Sort By" field is to click the heading at the top of the desired column. For example, to sort by name, click the "Name" cell at the top of the table. To reverse the sort order, click the heading again.
Find - Use this in conjunction with the "Sort By" key. Once you have selected the sorting key, enter the identifier you wish to find here. For example, if you are sorting by symbol, enter the desired symbol in the "Find" box. If you are sorting by CSI number, contract size or other numerical value, enter the number here. UA will locate and display your choice in the Market Spec factsheet.
If the "Find" feature does not reveal the market you desire, try the "Advanced Search" described below.
Footnotes
Be sure to check the footnotes at the bottom of the screen see if important information is available for your selected market. Click the market once to activate the footnote function.
Advanced Search
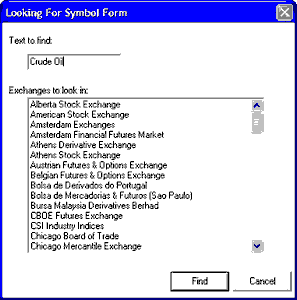
The "Find" feature shown above searches only on the beginning letters of the search string, which will usually lead you to your desired market. If it doesn't turn up your desired market, click the [Advanced Search] button at the bottom of the screen, which employs a more sophisticated search screen. The example below is for futures. A stock search screen would be a little different.

Text to find:
Enter the name or description of the market you wish to find in the "Text to find" box. For this example, we entered "Crude Oil," which produced the results shown below.
You may also fine-tune your search by selecting an exchange or exchanges from the list. This is not necessary, however.
Click [Find] to start your search.
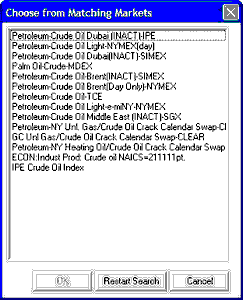
Choose Matching Market
UA will display all the markets holding the search string you entered, as in the example below for "Crude Oil." Click the one you wish to select and click [OK].
Click [Restart Search] if your choice isn't shown and try again with a narrower search criteria.

See the Chart Interpretation & Manipulation chapter for information on interpreting and manipulating your chart.