Unfair Advantage's Interpreted Study Library is a tremendous collection of published studies that have been added to UA at the request of CSI customers, as well as some unique programs that have been developed at CSI. A key feature of the Interpreted Studies module is that it allows you to modify the provided programs and even write trading algorithms of your own. Any study in the Interpreted Studies library can be added to your Study Toolbar for occasional or everyday use.
This feature places any indicator from the Interpreted Study Library onto the Study Toolbar for access.
To get to this point, launch the Study Toolbar from the Chart menu or from the "Indicators" icon on the UA toolbar. Click [Add Study] to display the following:
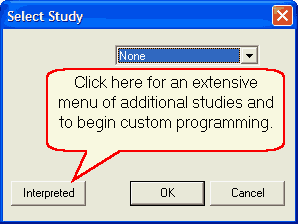
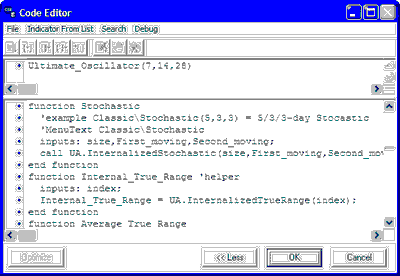
Click the [Interpreted] button to bring up the Code Editor screen. An example is shown below:
Language Selection
If you have a preference for using programs written in one language over another, click the "File" menu at the top of the screen and click "Change Language Mode."
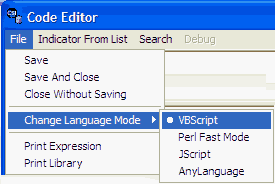
From the language menu, you may choose between Visual Basic, Perl, Java and CSI's own AnyLanguage. The lists of available programs are not necessarily identical in the various languages, so you might want to experiment to see which best meets your needs. See the Interpreted Studies chapter for more information on this.
Choosing Indicator from List
To view a list of available studies in your selected language, click "Indicator From List" at the top of the screen. A menu much like the following displays: (This example is for AnyLanguage Studies)
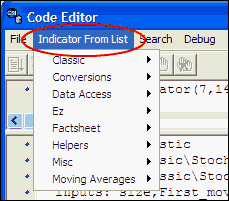
This list includes not only technical studies, such as stochastics and Ultimate Oscillator, but also several subroutines that may be useful in your own programming. Place your cursor on any of the indicator categories, and then click your choice on the resulting menu.
The exact offering of studies will depend upon the chosen language, but here is an example from the AnyLanguage Classic Menu:
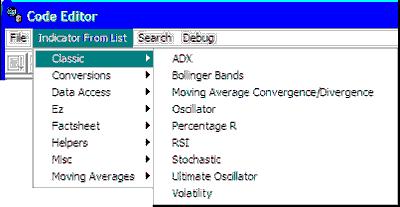
Selecting a study from the menu brings you back to the Code Editor form with the desired study selected. The required expression to launch the program displays in the top window and the full programming code displays in the lower window:
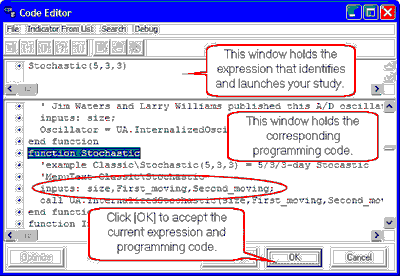
In reviewing this example, you'll see that the values within parentheses in the expression (top window) are default parameters for performing the study. The above Stochastics example has three parameters, which are 5, 3 and 3. They are defined in the line of code that reads:
inputs: size,First_moving,Second_moving;
This indicates that the first input is the (window) size, the second input is the first moving average and the third input is the second moving average, which is used for smoothing. You may change the default parameters in the expression line as desired.
For example, to change the window size to seven (7) days, you would adjust the expression in the top window to show:
Stochastic (7,3,3)
You may view and modify the code here as desired. (See the Edit Study topic and the Interpreted Studies chapter for more on all of this.)
Click the [OK] button at the bottom of the Code Editor screen to save your settings as a new entry on the Study Toolbar. The parameters you included in the expression will be part of the Study Toolbar entry, but the Study Library itself will not be changed unless you save your changes (see below)
Applying an Interpreted Study to Your Chart
Once the study is added to the Study Toolbar as described above, you may apply it to the active chart. See the "Apply Study" topic for instructions.
Saving Interpreted Studies
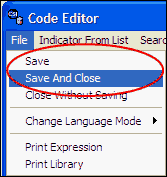
If you make changes to the Study Library that you want to save for all future applications (aside from the saved expression on the Study Tools menu), click "File" at the top of the Code Editor screen and then choose either "Save" or "Save and Close" from the menu. Alternately, click "Close Without Saving" to discard changes to the Study Library.
